Research & Data
Original research from live campaign data
We pick a category and track every brand in it, along with every live creator ad and every creator posting about them. Then we publish what we find. None of it comes from surveys. It is all measured from what the platforms actually show.
116
brands in one dataset
1,191
live ads tracked
130.3M
creator views analysed
361
day tracking window
This is one category dataset. Every report below is built the same way.
Published reports
There are two kinds of report. Both are built from the same data. Choose one below, or scroll down to see all of them.
10 reports
 July 2026
Elizabeth's
Better-for-you food: 116 brands, the live ads they run, and the plays a challenger can copy.
 July 2026
PowerUp Snacks
The US snacks category: the largest creative set we have published, mapped by hook, format and creator tier.
 June 2026
Slate Milk
The whole protein-drinks category. Who runs creator ads, which formats work, and the creators behind the top posts.
 June 2026
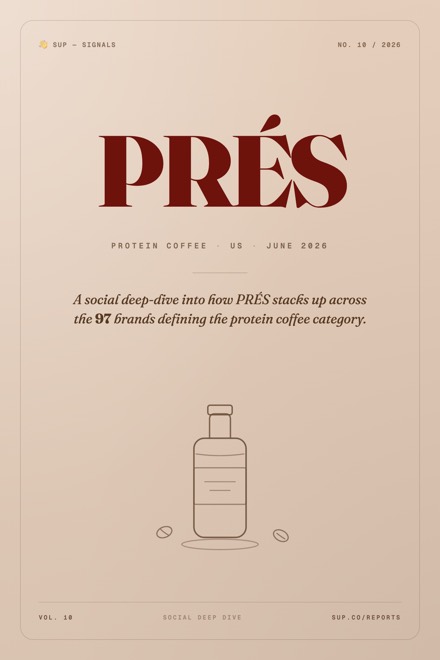
PRÉS
A challenger ranked 88 of 97 on followers but 41 of 97 on creators, and what it is leaving on the table in paid.
 June 2026
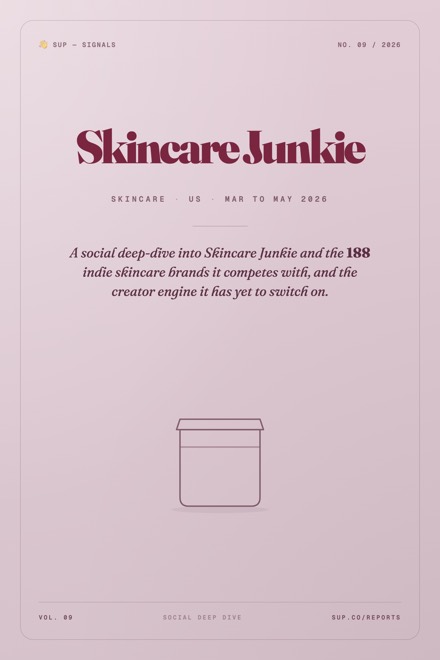
Skincare Junkie
Indie DTC skincare across paid, owned content and the creator conversation.
 June 2026
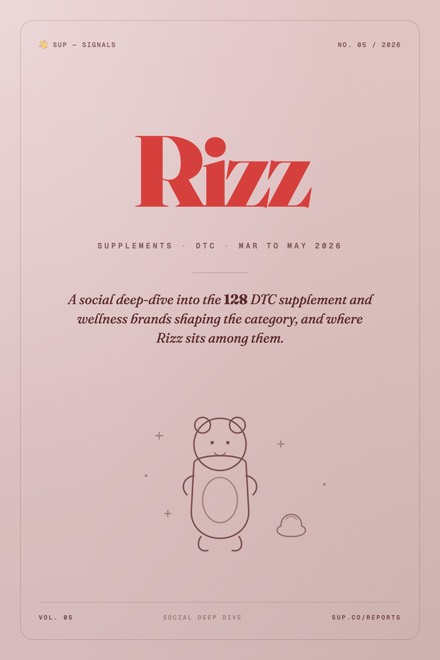
Rizz Superfood Gummies
A high-output gummy brand making creator-style content with almost no creators attached.
 May 2026
meCore
Where meCore stands across paid, organic, content and creators in the global fashion-app niche.
 May 2026
Hamburger Helper
Top 10 of 57 on ad volume, but bottom half on creators, and running none of the ten strategies its rivals use.
 May 2026
Buns From Home
Where Buns From Home stands in the London cafés and bakeries category.
 May 2026
GAIL's Bakery
The London cafés and bakeries category, built from 642 niche brands and 539 active ad creatives.
FAQ
Frequently asked questions
There are 10 published reports on this page. All 10 are brand reports, which read one company against its whole category. Niche benchmarks, which rank a whole category from top to bottom, are coming next. The most recent is Elizabeth's, published in July 2026.
So far we have published on Better-for-you food, US snacks, Protein coffee, Indie DTC skincare, DTC supplements, Fashion & creator apps, Boxed meal kits and London cafés & bakeries. If your category is not here yet, we can run it for you as part of a strategy call.
A brand report has one subject company. It reads that brand against every competitor in its category and ends with what we would do next if we ran their marketing. A niche benchmark has no subject company. It ranks the whole category so you can see who is winning, who is losing, and what separates them.
We draw the boundary ourselves and publish it, and every brand in the set is named inside the report. A different boundary would move every rank, so we show ours rather than asking you to trust it.
Each one covers every brand in a category, the live creator ads they run, the creators posting about them, and which of the 25 creator strategies we detect them using. All of it is measured from the platforms rather than surveyed. The limits are set out on our methodology page.
Yes. We build a free report on up to 100 of your competitors as part of a strategy call, using the same method as everything published here.
What is published here?
There are 10 published reports on this page. All 10 are brand reports, which read one company against its whole category. Niche benchmarks, which rank a whole category from top to bottom, are coming next. The most recent is Elizabeth's, published in July 2026.
Which categories have you covered?
So far we have published on Better-for-you food, US snacks, Protein coffee, Indie DTC skincare, DTC supplements, Fashion & creator apps, Boxed meal kits and London cafés & bakeries. If your category is not here yet, we can run it for you as part of a strategy call.
What is the difference between the two kinds of report?
A brand report has one subject company. It reads that brand against every competitor in its category and ends with what we would do next if we ran their marketing. A niche benchmark has no subject company. It ranks the whole category so you can see who is winning, who is losing, and what separates them.
How do you decide what a category is?
We draw the boundary ourselves and publish it, and every brand in the set is named inside the report. A different boundary would move every rank, so we show ours rather than asking you to trust it.
What do the reports actually measure?
Each one covers every brand in a category, the live creator ads they run, the creators posting about them, and which of the 25 creator strategies we detect them using. All of it is measured from the platforms rather than surveyed. The limits are set out on our methodology page.
Can I get one for my own category?
Yes. We build a free report on up to 100 of your competitors as part of a strategy call, using the same method as everything published here.
Want this run on your category?
We build a free report on up to 100 of your competitors as part of a strategy call. It uses the same analysis as the reports above, applied to your market.
Get your free report ›